
The Edgesense Architecture
This is a high level view of the architecture that we are imagining for the social network analysis component that is being developed for CATALYST.
The workflow of the tool would be something like:
- the community manager installs the component on his own Drupal site
- on first run the user has to configure the tool via a simple web page (or pages)
- the configuration wizard needs to be able to account for a broad range of content types. For example, the first Edgeryders iteration had content types named "Mission Briefs", "Mission reports" and "Campaigns". These will need to be mapped into edges or nodes of the network.
- the tool configures a set of JSON views in the drupal install to extract the data in a format usable by the analytics scripts
- on request from the social network analysis panel (SNA panel), or periodically (scheduled) the analytics scripts are run and:
- pull the json from the site
- load the data from the json
- build a network representation (the network representation is also written in a json file to be used by the SNA panel viz)
- compute the metrics and write the computed metrics in a json file (to be used by the SNA panel)
- the SNA panel has network and metrics visualizations that read the jsons produced by the analytics scripts and present them to the community manager
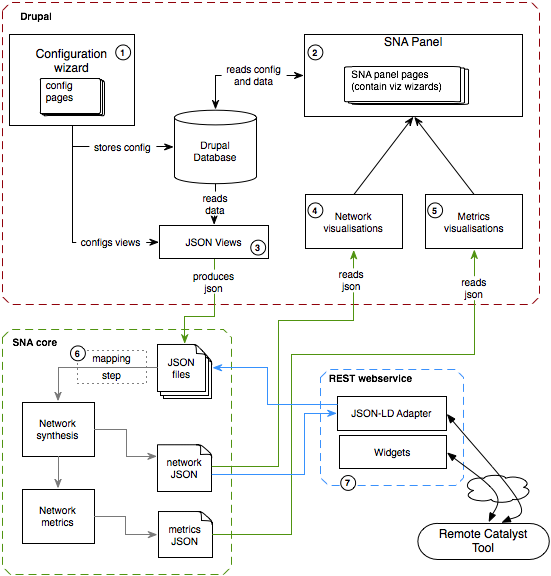
The configuration wizard, the panel and the data visualizations are implemented inside the drupal context (in one or more drupal modules).
The SNA core, is a (set of) python scripts with a simple command line interface, getting inputs and outputting results through writing and reading json files. They’ll be installed alongside our module but will be usable indipendently from it to build integrations on platforms other than Drupal.
An important element in the tool architecture will be the web service that allows integration in the larger CATALYST ecosystem.
The service will expose over HTTP:
- RESTful web services to send network data and get back json-ld metrics and network info
- javascript widgets for easy integration
Notes (to the drawing)
- the configuration wizard will be used to map the site elements into nodes and links and therefore to setup / configure the drupal json views. The configuration will probably also let the user choose which of the visualizations display in the panel. Also the anonymization of the data will be configured from here.
- The SNA panel will be a set of drupal pages presenting the configured visualizations and metrics. The visualizations will be browsable and where useful they will link into the original data.
- The JSON views will be the entry point for the analytics tool to pull data from drupal to be analyzed.
- This will implemented in js + html5
- This will implemented in js + html5
- Depending on the drupal flexibility in generating the JSON from the data we’ll need or not need to map the json views output into another intermediate representation.
- The JSON consumed internally by the analytics core will model the network to be analyzed. We'll keep this in an as simple as possible format and data model, considering them the tool “internal data representation”. One thing to consider in choosing the internal data model and representation file format is how hard or easy it is to use it while building the data visualizations. We’ll be able to write adapters for the exchange formats that we’ll like to support.